lingWAVES Electroglottography (EGG)
Introduction

Electroglottography – the Research Standard for Noninvasive Measurement of Vocal Fold Vibration and Assessment of Laryngeal Function Electroglottography allows for laryngographic assessment of phonatory function during connected speech, soft and loud singing. It gives qualitative and quantitative information about the contact, separation and open phase of vocal fold vibration and is therefore of great use in the interpretation of pathological conditions and follow-ups after surgical treatment or conservative voice therapy. It has proved particularly useful in assessment and documentation of organic voice disorders.
Before each new laryngographic examination of vocal fold vibration two electrodes are placed on the subject's neck at the level of the thyroid cartilage. The laryngograph detects variation in the electrical resistance of the current passed between the electrodes. The resistance is produced by changes in the nature and area of vocal fold contact during phonation. The electrolaryngographic output from the speaker's voice activity is displayed as a laryngograph waveform showing horizontal opening and closing movements of the vocal folds. Many of commercially available devices make it possible to record an additional signal (sound pressure waveform) from a microphone, which is synchronized with the laryngographic output, so that both waveforms can be directly compared when displayed one on top of another.
Electroglottography Analysis & Display
The lingWAVES EGG module fits seamless in the modular lingWAVES speech software package. It can be added as an upgrade to existing lingWAVES modules (eg. lingWAVES Suites, Phonetogram Plus, lingWAVES Voice Diagnostic Center (VDC)) or, if purchased as a new system, it can be enhanced by the addition of further software modules. lingWAVES users will definitely benefit working with a uniform and friendly software user interface for clinical voice analyses.
Analysis can be done in record or real time mode. The real time mode offer e.g. a real time display of a single perios (one opening and closing phase).
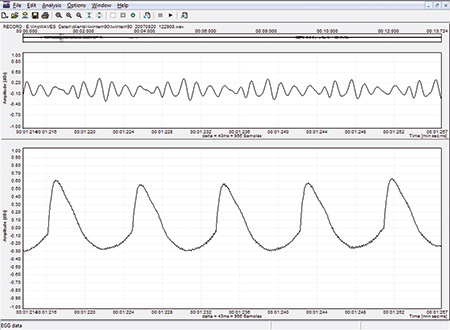
Real-time display of Lx-waveform
Opening and closing movements of vocal folds and optionally real-time display of acoustic (sound pressure) waveform, optional marking of open phases under zoom magnification and Analysis Open Quotient.
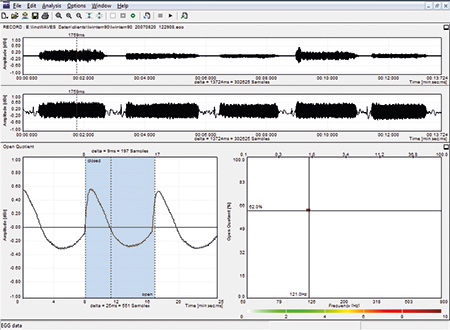
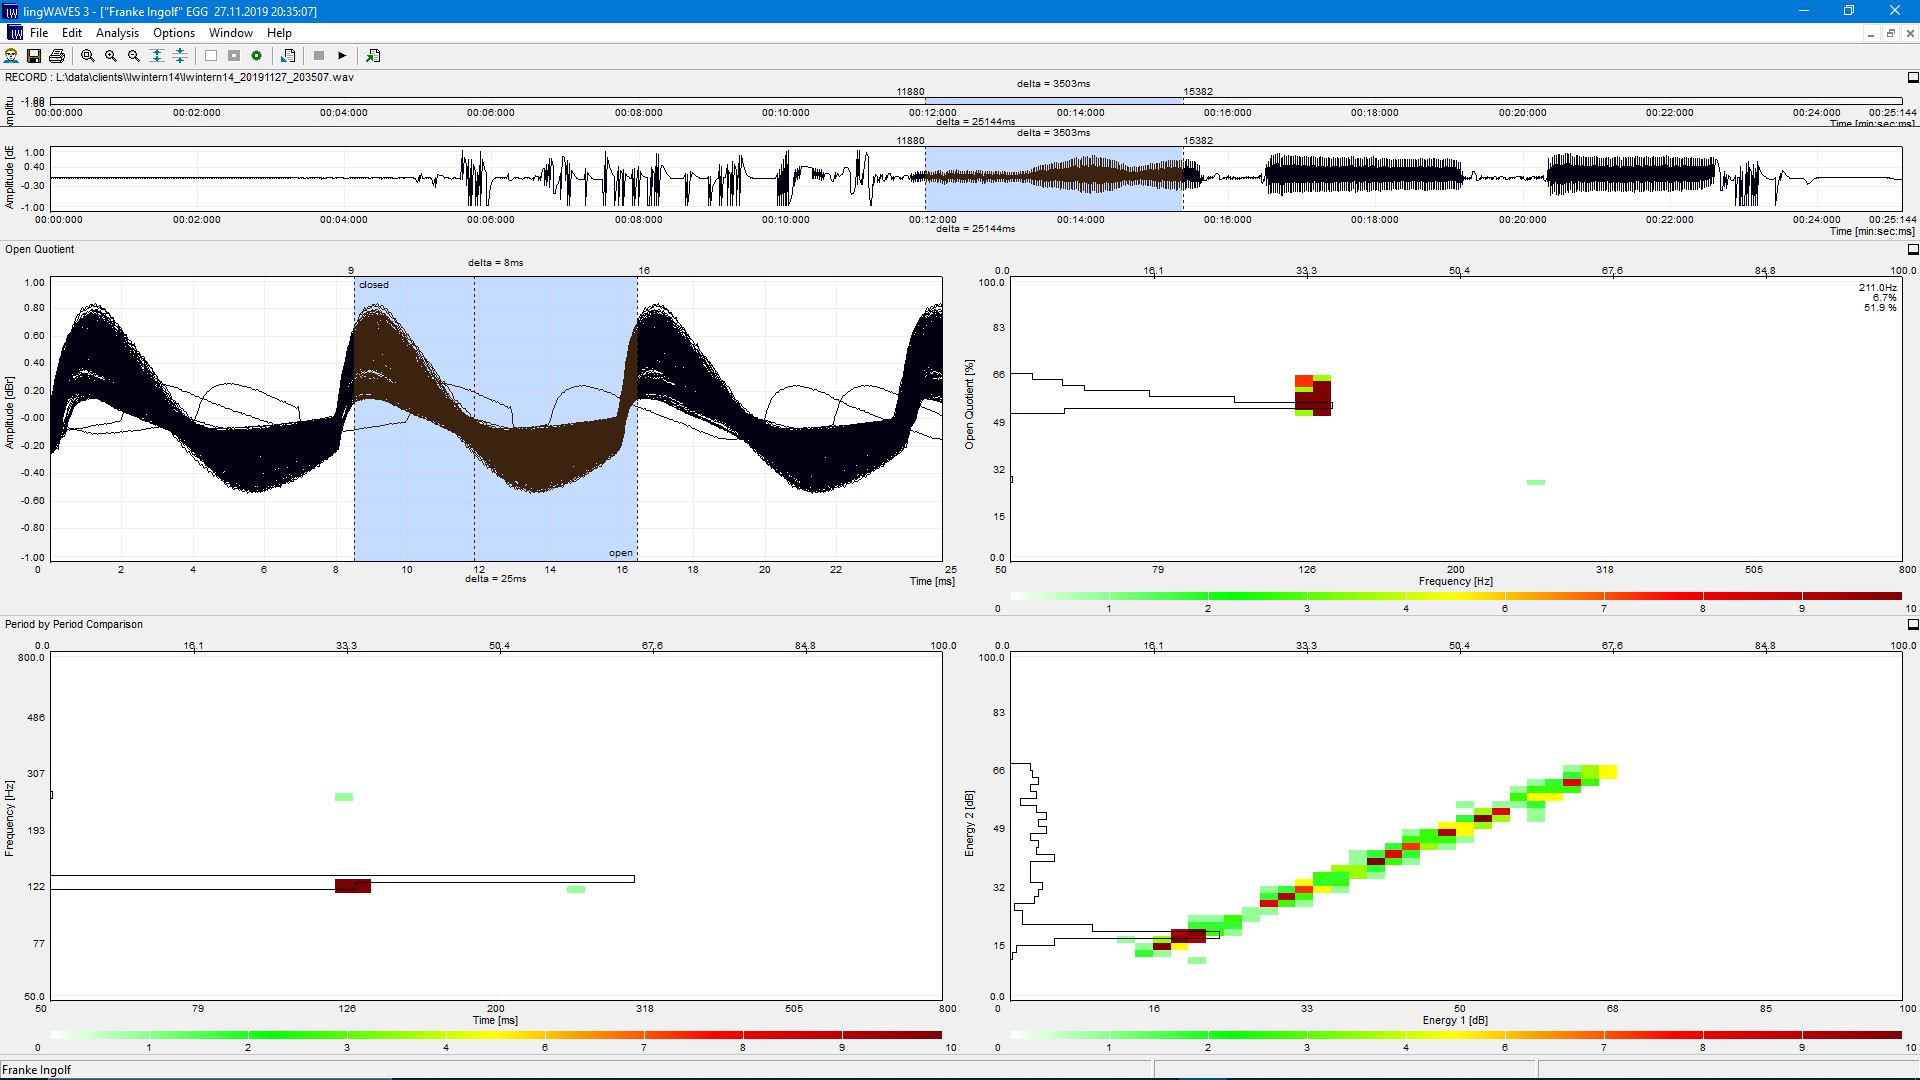
Open quotient
Open quotient is defined as the ratio between glottal open time and fundamental period. Displays available: Lx-waveform display with marked open phases, display of open quotient distribution in a speech sample, display of a plot of open quotient against fundamental frequency.
Vocal fold period cross plot
Cross plot contains information on the period to period differences in regards to frequencies. The graph on the down left shows Frequency 1 against Frequency 2, where Frequency 1 is the frequency value of the first vocal fold period in any pair of periods and Frequency 2 is the frequency value of the immediately following period of the pair. Regular vocal fold vibration (left) gives a clearly defined diagonal line since successive periods have almost the same values. For the pathological voice, the shape of a crossplot is more diffuse than is the case with normal speakers as the range of variability in period to period coherence is not under the speaker's control. The graph on the down right shows vocal fold frequency distribution (pitch range histogram), i.e. the range of frequencies contained in a sample.
Period by period amplitude crossplot
Provides an insight on the period to period differences in regards to amplitudes. The amplitude of one laryngeal vibration is plotted against that of the next vibration. There is little deviation from the ideal diagonal line distribution for the good normal voice.
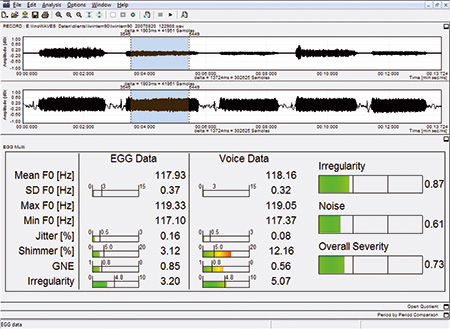
Instantaneous multi-parameter voice analysis for daily practice
The new EGG multi-parameter module allows for instantaneous processing of laryngograph and speech waveform data as well as multi-dimensional voice analysis at the push of a button. The module has all the important quantitative acoustic analyses most requested by clinicians, researchers and practitioners in daily practice. The available analyses build up a multi-dimensional voice profile that is presented on a complex display and can be printed for filing.
High precision jitter and fundamental frequency measurements
Jitter results from cycle to cycle variations of the fundamental frequency and is calculated as the mean period to period variation in the residual fundamental frequency values.
Multiple image display
Print out session results together with pre-post/trend analysis as hardcopy or PDF for client files.
lingWAVES - Acknowledged International Standard
After over 20 years of precense on the internationl market, lingWAVES is a highly acknowledged and recommended system for speeach and voice assessment, analysis and documentation. Take a look at recent articles with and about lingWAVES -> Knowledge
Take a look at other available lingWAVES modules for acoustic assessment and at the new lingWAVES 4 App for endoscopy, stroboscopy and high speed videoendoscopy.